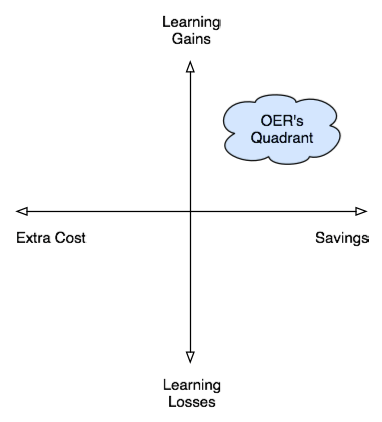
With apologies to Pasteur’s Quadrant, here’s another take on the Golden Ration of OER from earlier in the week. Mary made several points in the comments on that post about the interpretability of the measure. So, how about asking the same question visually?

I think you could still measure the vertical axis in standard deviations and the horizontal as change in budget (with savings being positive and additional costs being negative). To be clear, we would not expect to see learning gains simply because a piece of content has an open license. We’d hope to establish (a) at a minimum, no impact on student learning and some cost savings, or (b) more hopefully a positive impact on student learning and cost savings.
If you end up in any quadrant other than the one with the cloud, you or your project may be in serious trouble…
The “positive impact” comes because of teacher ability to use data to determine which pieces of open content net the greatest results in student achievement, AND THEN having the liberty to adjust said content accordingly. Content manipulation because it is open source saves vast amounts of time. Teachers don’t have to create an additional lesson, they just augment the existing one. Of course, this is all made easier by having content online in a malleable format to begin with!
That y access might be more reasonably labeled “learning opportunities” and still be very compelling.
Hm, re-reading your Golden Ratio post I may have to take that back; if you’re measuring learning outcomes, not just generalizable qualities of OER.