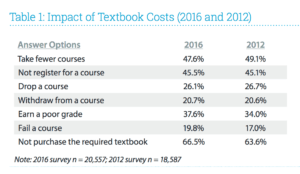
The good folks at Florida Virtual Campus have released the latest version of their Student Textbook Survey. There’s already been some great coverage (e.g., Phil Hill). However, I’ve also read people saying that the results are essentially unchanged from the 2012 survey to the 2016 survey. A quick look at Table 1 on page 11 seems to justify that claim:
However, inter-occular speculation is failing us here. An analysis of these data demonstrate that there are in fact some statistically significant differences in student responses from 2012 to 2016. The proportion of students who were impacted by the high costs of textbooks changed across the two surveys as follows:
- “Take fewer courses” was significantly lower in 2016 than in 2012.
- “Not register for a course” was unchanged from 2012 to 2016.
- “Drop a course” was unchanged from 2012 to 2016.
- “Withdraw from a course” was unchanged from 2012 to 2016.
- “Earn a poor grade” was significantly higher in 2016 than 2012.
- “Fail a course” was significantly higher in 2016 than 2012.
- “Not purchase the required textbook” was significantly higher in 2016 than 2012.
The negative impact of the high cost of textbooks, as presented in the 2012 survey results, was already unacceptably high. The situation is largely the same or worse four years later.
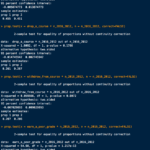
Here’s the R code so you can re-run the analysis yourself, along with a screen grab of the full results (click to enlarge).
# Responses from 2016 and 2012, Table 1, p. 11
# https://dlss.flvc.org/documents/210036/361552/2016+Student+Textbook+Survey.pdf
take_fewer_courses < - c(.476, .491)
not_register_for_a_course <- c(.455, .451)
drop_a_course <- c(.261, .267)
withdraw_from_course <- c(.207, .206)
earn_a_poor_grade <- c(.376, .34)
fail_a_course <- c(.198, .17)
not_purchase_textbook <- c(.665, .636)

# Survey n for 2016 and 2012, Table 1, p.11
# https://dlss.flvc.org/documents/210036/361552/2016+Student+Textbook+Survey.pdf
n_2016_2012 <- c(20557, 18587)

# Chi-squared test for equality of proportions
prop.test(x = take_fewer_courses * n_2016_2012, n = n_2016_2012, correct=FALSE)
prop.test(x = not_register_for_a_course * n_2016_2012, n = n_2016_2012, correct=FALSE)
prop.test(x = drop_a_course * n_2016_2012, n = n_2016_2012, correct=FALSE)
prop.test(x = withdraw_from_course * n_2016_2012, n = n_2016_2012, correct=FALSE)
prop.test(x = earn_a_poor_grade * n_2016_2012, n = n_2016_2012, correct=FALSE)
prop.test(x = fail_a_course * n_2016_2012, n = n_2016_2012, correct=FALSE)
prop.test(x = not_purchase_textbook * n_2016_2012, n = n_2016_2012, correct=FALSE)


Another important point to emphasize is that the table you share is the aggregated student perspective, which includes PhD and Masters students. If you look only at students at 4 year universities and community colleges the 2016 results are significantly worse. For example, almost 60% of community college students report taking fewer courses because of textbook costs.